
The Factory Is Faster Series · 03
How Much Customer Concentration Is Too Much for a Manufacturer? Why the Percentage Matters Less Than What Stands Behind It
Is one customer too big a share of your manufacturing business? See the thresholds buyers use and take the free Manufacturing Growth Opportunity Assessment.

“There is no fixed penalty for concentration. There is always a question, and the discipline is to answer it with evidence rather than with fear or with comfort.”
— Curtiss Witt
No single percentage makes customer concentration “too much.” What matters is how durable the relationship is, how much of your constraint the customer consumes, and how long it would take to replace the work if it shrank. That said, buyers of manufacturing businesses do apply thresholds. M&A advisory firm CT Acquisitions says a top customer under 15% of revenue draws no discount, 25% to 40% can cost 0.5 to 1.5 turns of EBITDA, and 50% or more can compress the multiple by 1.5 to 3 turns. The percentage tells you where to look. It never tells you what you will find.
What customer concentration thresholds do buyers and lenders use?
Buyers of manufacturing businesses treat concentration as one of the biggest adjustments to value. CT Acquisitions’ 2026 framework sets these bands for the largest customer’s share of revenue: under 15%, no discount; 15% to 25%, acknowledged in diligence; 25% to 40%, a 0.5- to 1.5-turn reduction in the EBITDA multiple; 40% to 50%, deals pushed toward earnout structures; and 50% or more, a compression of 1.5 to 3 turns. The same firm calls customer concentration above 25% the single biggest re-trade driver in manufacturing diligence, and recommends mitigating it 12 to 18 months before going to market.
Accounting standards treat concentration as material, too. Under U.S. generally accepted accounting principles, public companies must disclose when revenue from a single external customer reaches 10% or more of total revenue (FASB ASC 280-10-50-42). If you plan to sell your business in the next few years, concentration is a number buyers will find whether you look at it or not.
Those thresholds describe how buyers price risk at the moment of a sale. They say much less about how safe your business is on an ordinary Tuesday.
Why does the concentration percentage alone mislead?
The percentage alone misleads because it blends three different things: reported dependence, management comfort, and established risk. Reported dependence is the share of revenue, throughput, and constraint time the largest accounts consume. Management comfort is how leadership feels about it. Established risk is what can actually be shown about the relationship’s durability: agreement terms, sole-source status, switching costs for the customer, tooling and approvals you control, the remaining life of the customer’s programs, and recent signals like buyer turnover.
Consider two shops. One has 40% of its business in a single customer, under a multiyear agreement for sole-sourced parts on a program with years to run. The other has 20% in a customer that buys commodity work purchase order by purchase order and resources it every year. The first shop’s percentage is twice as high. Its real risk may be lower.
As I wrote in The Factory Is Faster. Where Are the Customers?: “There is no fixed penalty for concentration. There is always a question, and the discipline is to answer it with evidence rather than with fear or with comfort.”
How does a big anchor customer quietly reshape a manufacturer?
An anchor customer reshapes a manufacturer by gradually configuring the plant, the quality system, and the sales function around one buyer’s needs. Anchor accounts usually come from doing something very well for someone who needed it, and they bring real advantages: predictable volume, learning-curve gains, and engineering collaboration. They also bend the business. The plant gets arranged around the anchor’s part families and lot sizes. Pricing tightens through years of annual negotiations. Gradually, the company becomes very good at being that customer’s supplier, which is not quite the same as being good at being a supplier.
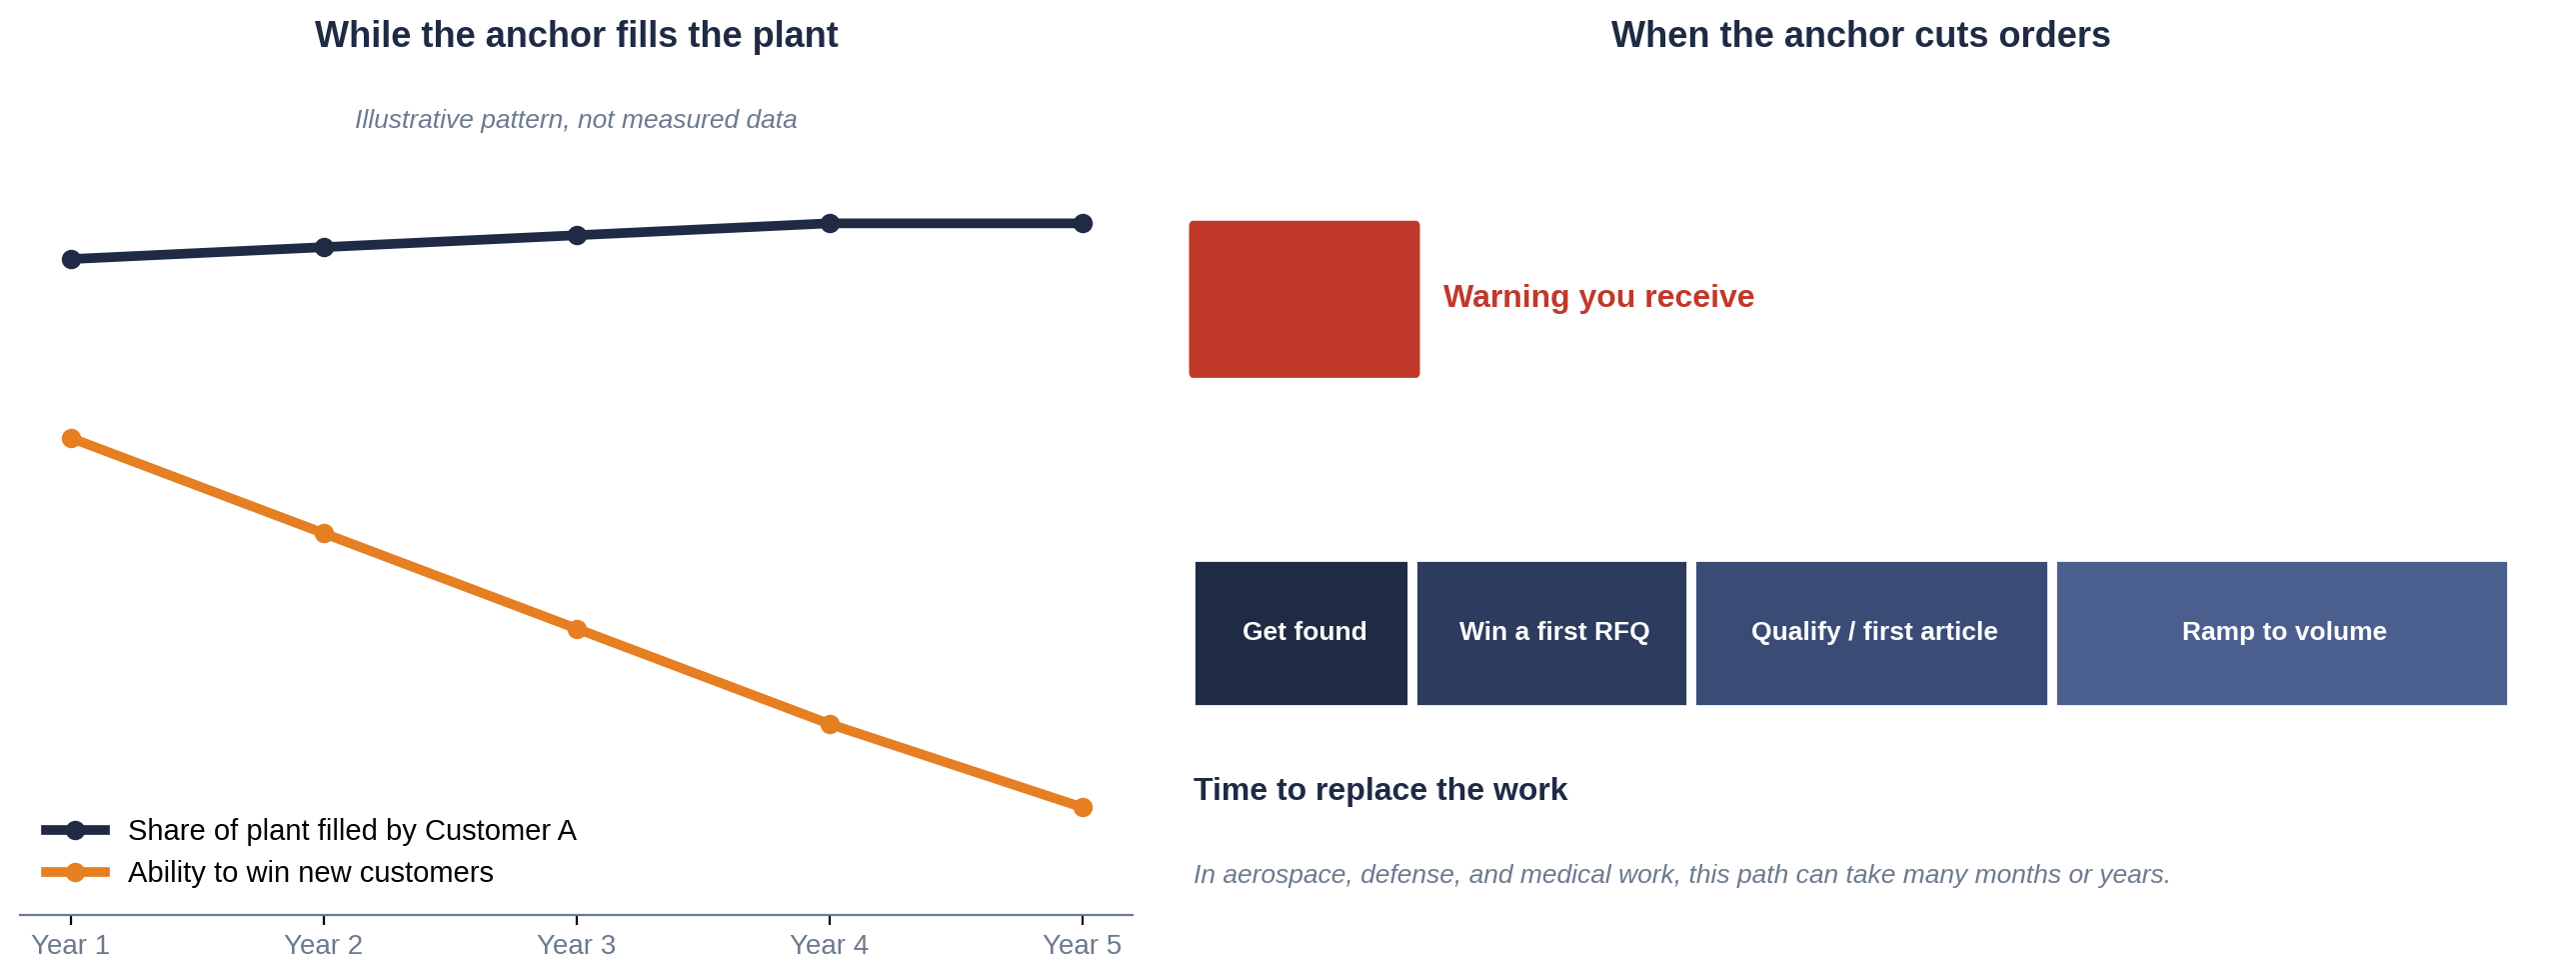
The largest effect is commercial. When one customer fills the plant, the company stops needing to develop new business, so it stops developing the ability to do so. A company whose anchor fills its plant does not experience a market constraint. It experiences success, right up until the anchor changes its mind.
What happens when the biggest customer cuts orders?
When the biggest customer cuts orders, the real danger is timing: replacing the work takes far longer than the warning you receive. Anchor customers change for reasons that have nothing to do with your performance: a program ends, work is brought in-house, a new procurement leader resources part families, the customer is acquired. The warning signs are usually visible: a new buyer with a different mandate, forecasts that soften and stay soft, requests for detailed cost breakdowns, or parts you already make showing up in other suppliers’ quote requests.
Developing a new customer in industrial markets means being found, earning a first request, quoting, winning, passing first-article inspection or qualification, and ramping from trial quantities to real volume. In regulated industries like aerospace, defense, and medical devices, that path can take many months or years. Diversification has a lead time, and it is usually longer than the notice the business will get. That’s why customer development has to run while the anchor is healthy, not after it leaves.
How should a manufacturer diversify without hurting the factory?
A manufacturer should diversify toward a specific kind of customer whose work fits the plant, not away from concentration at any price. Diversifying by taking whatever new work appears often trades a concentration problem for a mix problem: poorly matched orders clog the constraint and hurt delivery to the very anchor you were protecting yourself from. Diversify toward something specific, built on three pieces of evidence:
- Account history. Several years of revenue, throughput, and constraint time by major customer, plus how each account’s quotes have fared.
- A replacement scenario. If your largest customer’s volume fell meaningfully next year, which resources would open up, what work could fill them, and how long would finding it take?
- A suitable-customer profile. The industries, part types, materials, lot sizes, documentation needs, and ordering behavior shared by the customers who fit your plant best.
If you want a structured starting point, take the Manufacturing Growth Opportunity Assessment at AIManufacturingGrowth.com/assessment. Its customer concentration domain helps your leadership team frame what it knows about dependence, records what it doesn’t, and names the evidence to assemble next.
| Fear-driven diversification | Evidence-driven diversification |
|---|---|
| Reacts after the anchor signals trouble | Runs continuously while the anchor is healthy |
| Chases any new customer that appears | Targets customers who match a written fit profile |
| Judges concentration by revenue share alone | Weighs agreements, sourcing status, and constraint time |
| Risks loading the constraint with poor-fit work | Protects delivery to existing customers |
| Treats the anchor as a threat | Treats the anchor as a model of what good fit looks like |
Your next step
If you plan to sell your business, buyers will price your concentration whether you’ve examined it or not, and CT Acquisitions recommends addressing it 12 to 18 months before going to market. If you don’t plan to sell, the clock is the warning your anchor customer gives you. Either way, the time to understand your exposure is before you need to. Start at AIManufacturingGrowth.com/assessment.
Disclaimer
The Manufacturing Growth Opportunity Assessment is an educational investigation guide. It organizes what you report about your business into areas to review and information to gather. It does not diagnose your business, identify your system constraint, value any opportunity, or forecast results, and it is not legal, financial, or compliance advice.
FAQ
How much customer concentration is too much for a manufacturer?
No single percentage settles it. Durability matters more than share. For business sales, CT Acquisitions says discounts typically begin when the largest customer exceeds 25% of revenue and grow steeper above 50%.
Does customer concentration lower the value of my manufacturing business?
Often, yes, when you sell. CT Acquisitions’ framework applies a 0.5- to 1.5-turn EBITDA discount at 25% to 40% concentration and 1.5 to 3 turns at 50% or more, adjusted for contracts and sourcing status.
Is a long-term agreement enough protection?
It helps, but only for what it actually commits the customer to and for as long as the underlying program runs. Read the terms, and know when the program ends.
What are the warning signs a big customer may cut orders?
A new buyer with a different mandate, softening forecasts, requests for detailed cost breakdowns, new supplier-development programs, and your part numbers appearing in other suppliers’ quote requests.
Can the assessment tell me whether my concentration is dangerous?
No. It records what your leadership team reports and names the evidence to examine. It never concludes that a customer will leave or estimates an effect on value.
Do I have to share customer names or financials to take the assessment?
No. The assessment at AIManufacturingGrowth.com/assessment asks for no customer names, exact revenue, email, or account, and shows its findings on screen when you finish.
References
CT Acquisitions. (2026). What Is My Manufacturing Business Worth? https://ctacquisitions.com/?p=10491
CT Acquisitions. (2026, June 10). Manufacturing Business Valuation (2026): 3x–9x EBITDA by Sub-Vertical. https://ctacquisitions.com/?p=10492
CT Acquisitions. (2026). Sell Manufacturing Business. https://ctacquisitions.com/?p=10701
Financial Accounting Standards Board. Accounting Standards Codification Topic 280, Segment Reporting, paragraph 280-10-50-42.
Witt, C. (2026). The Factory Is Faster. Where Are the Customers?
← All Manufacturing Growth Insights